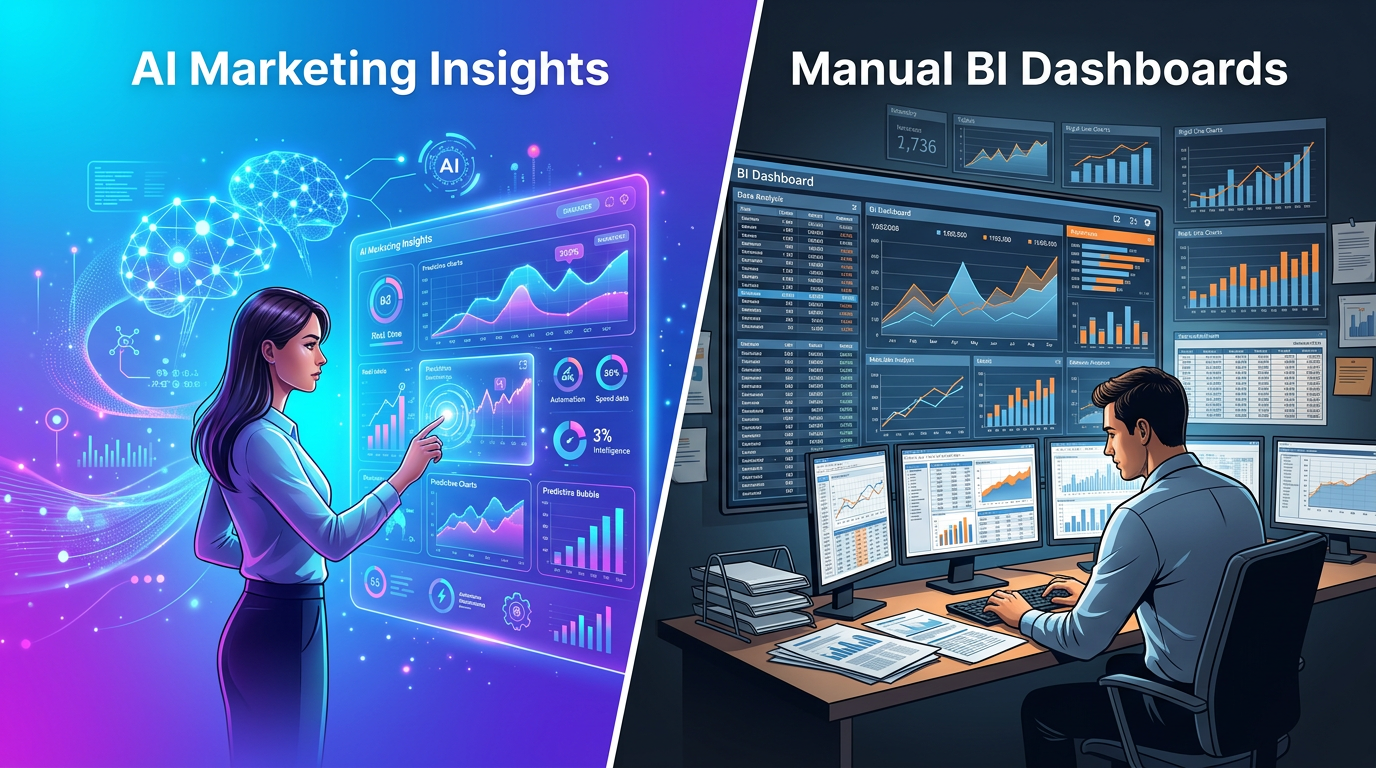
AI-driven marketing insights and manual BI dashboards serve a similar purpose helping teams understand performancebut they approach the work differently. A traditional dashboard presents metrics, charts, filters, and trends for people to investigate. An AI-driven workflow can analyze connected marketing data, surface patterns, answer questions in natural language, and help identify areas that warrant attention.
The distinction is not simply dashboards versus AI. Modern BI platforms increasingly include AI-assisted insights, while AI marketing systems can still depend on dashboards and governed data models. Google Cloud, for example, describes newer BI experiences that combine dashboards with conversational analytics and AI agents, while Microsoft Power BI provides automated insights from dashboard and report data.
For marketing teams, the practical question is where analytical work should happen. If the team needs to repeatedly inspect the same set of charts and manually investigate changes, AI can reduce some of that effort. If the business needs a governed, auditable view of defined metrics, dashboards remain important.
Why the Reporting Workflow Matters
Marketing reporting often begins with a simple question: what changed? The harder question is why it changed and what the team should do next.
A dashboard can make the first question easy to answer by putting spend, conversions, revenue, cost per acquisition, and other metrics into one view. The analyst still needs to investigate unusual movements, compare time periods, segment audiences, check campaign changes, and connect the findings to business context.
AI-driven insights can move some of this investigation closer to the reporting layer. Modern BI products increasingly support natural-language questions and automated pattern detection. Google Cloud says its dashboard agents are designed to let users ask follow-up questions about BI data, while Power BI's Insights feature can identify trends, unusual values, and patterns in dashboard and report data.
The value is not that AI eliminates analysis. It can reduce the amount of manual exploration required before an analyst reaches a useful explanation.
How AI-Driven Insights and Manual Dashboards Work
A manual BI dashboard usually starts with a defined reporting requirement. Data is connected, metrics are modeled, visualizations are configured, filters are added, and the dashboard is reviewed before being shared with users.
That structure is useful because it creates a repeatable reporting surface. Everyone can see the same definitions and, when governance is set up correctly, work from the same underlying data model.
AI-driven insight systems add an analytical layer on top of connected data. Instead of requiring the user to know which chart to open, they may allow questions such as: Which campaigns drove the largest change in conversion rate this week? What changed in paid social performance? Which audience segments are contributing to the increase in acquisition cost?
The exact capability depends on the platform and data model. AI output is only as useful as the data, definitions, permissions, and context available to the system.
From Finding the Number to Explaining the Change
The biggest workflow difference appears after a metric moves.
Suppose acquisition cost rises 18% week over week. A dashboard can show the change and allow an analyst to investigate by channel, campaign, audience, geography, device, or date.
An AI-driven system can potentially surface the change, identify related patterns, and summarize likely contributors without requiring the user to inspect every chart manually. Microsoft describes Power BI Insights as a way to automatically identify patterns such as unusual spikes, correlations, and seasonal changes.
That speed matters when teams manage campaigns across several channels. NYX notes that separate platform dashboards can create inconsistent reporting and isolated data, making it harder to understand overall campaign performance.
The important distinction is between detection and decision-making. An AI system can highlight a meaningful change, but the marketing team still needs to decide whether the change requires action.
Decision Criteria: AI-Driven Insights vs Manual BI Dashboards
Criterion | AI-Driven Marketing Insights | Manual BI Dashboards |
Primary role | Surface, explain, and explore patterns faster | Present governed metrics and visual analysis |
Time to insight | Fast for common analytical questions | Depends on user exploration and analyst support |
Exploration | Natural-language and automated analysis where supported | User-driven filters, charts, and reports |
Governance | Depends on underlying data model and controls | Strong when dashboards use governed models |
Repeatability | Can automate recurring insight workflows | Strong for standardized reports |
Human effort | Lower for routine investigation | Higher for manual exploration |
Best fit | Rapid investigation and proactive insight discovery | Executive reporting, KPI monitoring, and governed analysis |
Where Manual BI Dashboards Still Have an Advantage
Manual dashboards remain valuable because they provide a stable reporting framework that teams can govern, audit, and reuse.
They are particularly useful when teams need:
Recurring executive reporting
Standardized KPI definitions
Auditable metric definitions
Complex filters and segmentation
Scheduled reporting and alerts
Cases where stakeholders need to see the underlying visualization
The Cost of Waiting for Analysis
Manual analysis has an operational cost that is easy to overlook. A dashboard may already contain the required data, but the insight can still depend on an analyst having time to investigate it.
This creates a queue when marketing teams have many questions at once. Analysts may need to prepare extracts, create new views, compare periods, investigate segments, and explain the findings to stakeholders.
AI-driven analysis can reduce some of that repetitive exploration by answering common questions directly or surfacing anomalies without requiring a new dashboard for every question.
That does not mean every analytical task should be automated. High-impact decisions still benefit from human review, especially when the answer depends on business context that is not present in the data.
Data Governance and Trust Cannot Be Automated Away
Speed does not compensate for unreliable data. Both dashboards and AI-driven insight systems depend on consistent definitions, complete inputs, appropriate permissions, and accurate source data.
Google Cloud emphasizes governance and permissions in its AI-enabled BI experiences, including showing the sources and filters behind generated insights.
Marketing teams should therefore establish a clear source of truth for core metrics such as spend, conversions, revenue, acquisition cost, and return on ad spend.
Governance should also cover:
Metric definitions and business logic
Source-system ownership
Data freshness and completeness
Access controls and permissions
Campaign naming and taxonomy
Auditability of important decisions
How Each Approach Handles Cross-Channel Marketing Data
Cross-channel reporting exposes one of the main limitations of isolated dashboards. A marketing team may have separate reporting environments for paid search, paid social, display, email, analytics, CRM, and sales data.
Manual BI can consolidate these sources into a governed dashboard, but building and maintaining the data model requires technical work.
AI advertising platform capabilities, particularly when users can ask questions without knowing the underlying schema. However, natural-language access does not solve data integration problems by itself.
NYX's multi-channel advertising content highlights the operational challenge of managing campaigns across platforms with different dashboards and reporting formats.
The strongest setup is therefore not AI instead of BI infrastructure. It is a trusted data layer that supports both structured reporting and faster analysis.
Which Decisions Benefit Most From AI-Driven Insights
AI-driven insights are most useful when the team needs to move quickly from a metric change to an investigation.
Strong use cases include:
Investigating sudden performance changes
Finding unusual movements across campaigns or audiences
Comparing multiple channels without manually opening each dashboard
Answering recurring performance questions
Identifying patterns that deserve analyst review
Turning large datasets into concise decision briefs
Where AI-Driven Analysis Still Needs Human Judgment
AI-generated explanations should not be treated as automatic business decisions.
A model can identify a correlation or pattern, but the marketing team needs to establish whether it is meaningful. For example, a rise in conversion rate may coincide with a campaign change, but the result could also reflect seasonality, audience mix, tracking changes, or a temporary promotion.
Human review is particularly important when:
The decision affects a significant budget allocation.
The underlying data has known gaps.
The insight conflicts with established business context.
A causal claim is being made from observational data.
The output will be used for executive or financial reporting.
Choosing the Right Operating Model
The choice between AI-driven insights and manual dashboards is rarely binary. Most mature marketing organizations need both.
Use dashboards as the governed reporting layer and AI-powered marketing insights. This separates two jobs that are often mixed together: establishing what the business metrics are and helping users understand what is changing within those metrics.
A practical decision framework is:
Keep governed dashboards for recurring reporting and KPI definitions.
Use AI to accelerate investigation and exploration.
Validate important AI-generated findings against the underlying data.
Use human review for high-impact budget and strategic decisions.
Measure whether faster insight actually improves decision speed or business outcomes.
How Teams Can Combine AI Insights With BI Dashboards
A hybrid model can provide the strongest balance of governance, transparency, and speed.
Dashboards can remain the reference point for executive reporting, recurring business reviews, and standardized KPI definitions. AI can sit on top of the same governed data to help teams explore trends, answer follow-up questions, and surface unusual changes.
Google Cloud's current BI direction reflects this convergence: Looker combines governed semantic modeling with conversational analytics and dashboard agents, rather than treating AI and dashboards as separate reporting systems.
For marketing teams, the practical outcome is a workflow where users do not have to choose between a fixed dashboard and an unstructured AI answer. They can start with trusted metrics, investigate through natural language, and return to the underlying dashboard or data model when the decision requires verification.
Key Takeaways
AI-driven insights can reduce the time required to investigate marketing performance and surface patterns across connected data.
Manual BI dashboards remain valuable for governed reporting, standardized KPIs, recurring executive reviews, and transparent data exploration.
The quality of either approach depends on reliable data, consistent metric definitions, and appropriate governance.
A hybrid model usually provides the strongest operating structure: dashboards establish the trusted reporting layer, while AI accelerates analysis and insight discovery.