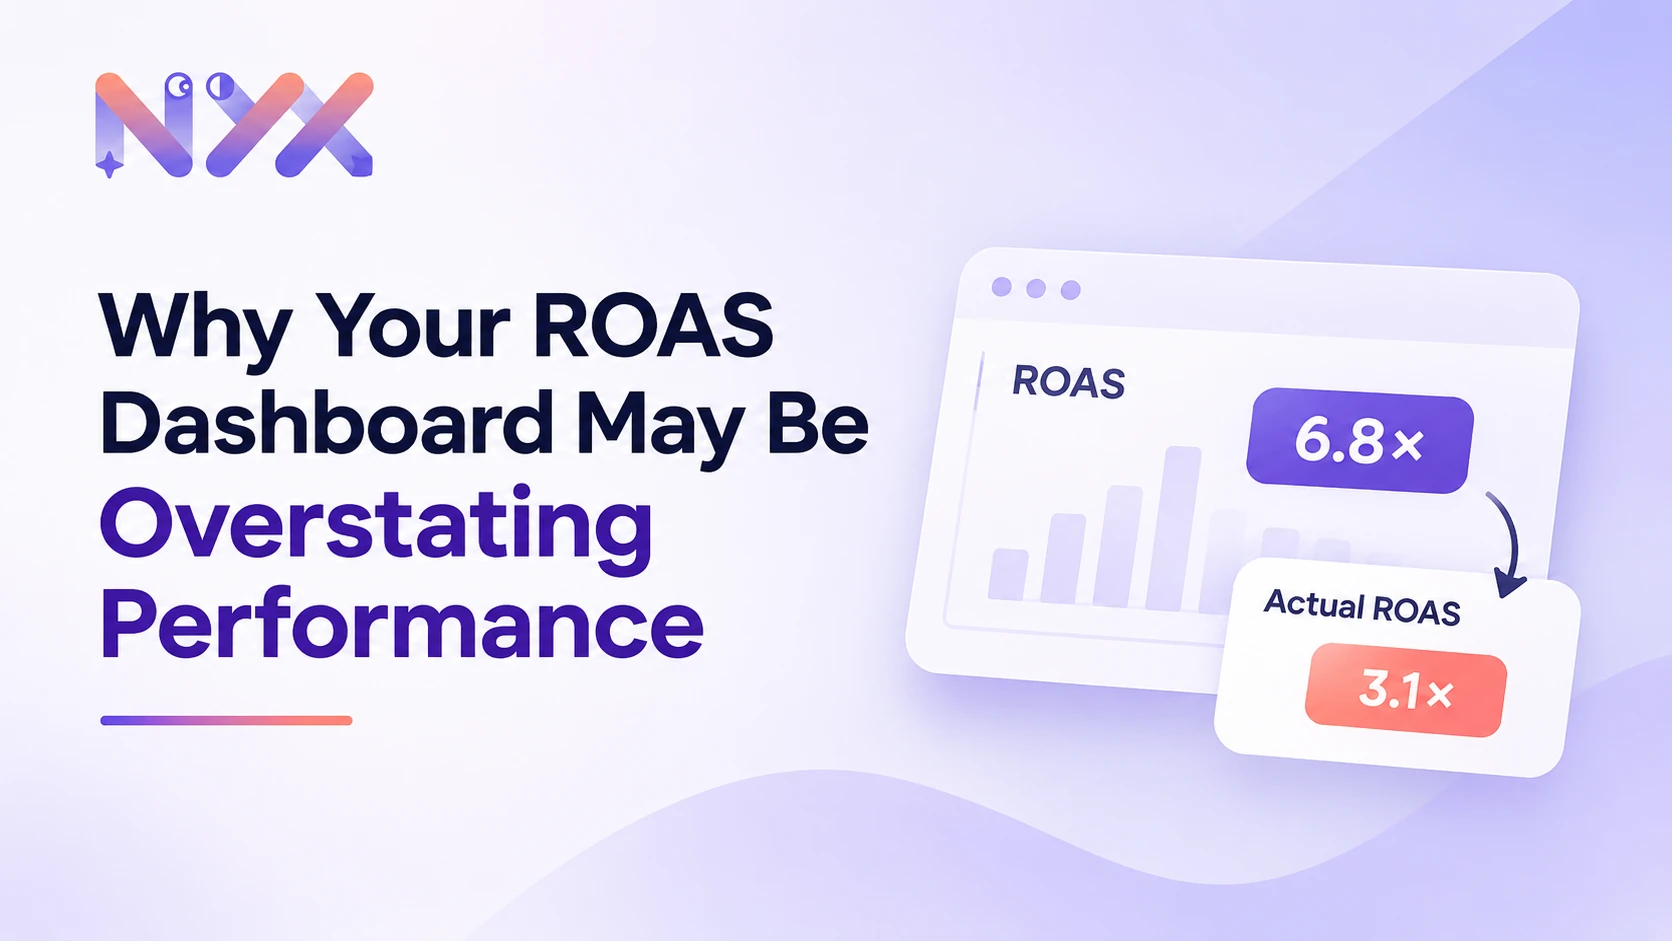
Your Meta dashboard says 4x. Google says 6x. Your email tool claims a good chunk of sales too. Then you open your bank account, and the money does not match the story. If that sounds familiar, you are not alone, and your ads are probably not lying on purpose. They are just answering a different question from the one your business is asking.
This guide explains true ROAS measurement in plain language: why platform-reported ROAS runs high, how double counting and view-through attribution inflate it, and the four tools that give you the real number: blended ROAS, MER, the holdout test and marketing mix modeling. By the end you will have a 30-day plan to find the return your ads actually create.
Key Takeaways
|
What Is True ROAS?
True ROAS is the revenue your advertising actually caused, divided by what you spent on it. The word that matters is caused. A sale that would have happened without the ad does not count.
Platform-reported ROAS is different. It is the revenue an ad platform attributes to itself under its own rules. Attribution answers "which ads were around before this sale?" True ROAS answers "which sales would vanish if we turned the ads off?" Those two answers can be very far apart.
Metric | Formula | What it tells you |
|---|---|---|
Platform-reported ROAS | Platform-attributed revenue ÷ platform spend | How much credit one platform gives itself |
Blended ROAS | Total store revenue ÷ total ad spend | Whether the business as a whole earns back its ad spend |
MER (marketing efficiency ratio) | Total revenue ÷ total marketing spend (ads, agencies, tools, influencers) | How efficient all of marketing is together |
Incremental ROAS (iROAS) | Incremental revenue from a test ÷ test spend | What ads truly caused |
Why Platform-Reported ROAS Runs High
Meta, Google and every other ad network grade their own homework. None of this is a bug. Each platform is built to show advertisers its own value, and four mechanics push the number up.
1. Double counting across platforms
A shopper sees your Instagram ad on Monday, clicks a Google Shopping ad on Wednesday and buys after opening your email on Friday. Meta claims the sale. Google claims the sale. Your email tool claims the sale. One order, three owners.
This is why the revenue claimed by each channel almost always adds up to more than you actually sold. Databox research cited by Hyros found that summing platform-reported conversions typically produces 150 to 250 percent of actual closed customers. The quickest test you can run today is to add up every platform's claimed revenue for last month and compare it with your Shopify or backend total.

Figure 1: Illustrative D2C month. Platforms claim ₹87 lakh against ₹60 lakh of real sales.
2. View-through attribution
View-through attribution gives an ad credit when someone saw it but did not click, then bought later. Meta's default setting counts a purchase within 1 day of a view. A scroll past a video in a busy feed is enough. If that person was already on their way to buy, the ad gets credit for a sale it did not cause.
The effect can be large. Polar Analytics describes one account where Meta claimed about $156K in revenue while server-side data showed roughly $52K in click-driven sales, a gap driven mostly by view-through credit and duplicate counting.
3. Captured demand versus created demand
Brand search and retargeting look brilliant on dashboards because they reach people who already know you and are close to buying. Bidding on your own brand name often catches a customer who would have clicked your organic listing one line below. The ad is captured demand, not created demand.
Public Haus case studies summarised by Eightx put the gap between platform ROAS and measured iROAS at roughly 1.5x to 3x, and the gap is widest on brand search and retargeting. Common Thread Collective's benchmark example shows the same pattern: a Google platform ROAS of 12.5x fell to a 3.1x iROAS, while a Meta 3.2x actually rose to 3.7x once measured properly.
4. Modeled conversions and tracking gaps
Since iOS privacy changes and cookie loss, platforms fill blind spots with modeled conversions, which are statistical estimates of sales they could not observe. Modeling is useful, but it is still the platform estimating its own impact. The gap can also run the other way: Measured reported in May 2026 that platform reporting can understate the incremental value of YouTube and Demand Gen by as much as four times. That is the real lesson. Dashboards are not always too high. They are just not reliable for comparing channels.

Figure 2: The pattern most holdout tests reveal. Bottom-funnel channels shrink, upper-funnel video often grows.
Blended ROAS and MER: Your First Reality Check
Before you buy any measurement tool, calculate two numbers every week from data you already own.
Blended ROAS divides total store revenue by total ad spend across every platform. It cannot double count, because each order appears once in your store. MER widens the lens to all marketing costs, including agency fees, creator payments and software.
Here is a simple example. A brand spends ₹15 lakh on Meta and Google in a month and records ₹60 lakh in total revenue. Blended ROAS is 4.0x. Add ₹3 lakh of agency and influencer costs and MER is 3.3x. Meanwhile the platforms claim ₹87 lakh between them, which would imply 5.8x. The honest number is the first one.
How to read blended ROAS and MER
|
Incrementality: The Question That Actually Matters
Incrementality means the extra sales that happened only because of your ads. It is measured with experiments, the same way medicine tests a drug: one group gets the treatment, one does not, and the difference is the effect.
How a holdout test works
A holdout test keeps ads away from a matched group of people or regions and compares their sales with the group that saw ads. The two most common designs are:
Geo holdout: turn ads off in a set of cities or states that historically behave like the cities where ads stay on. Works across every channel and needs no user tracking.
Conversion lift study: Meta and Google randomly hold back a share of your audience inside their own systems. Easier to run, but still measured by the platform.
Steps to run a basic geo holdout:
Pick one channel or campaign type to test, such as Meta retargeting or brand search.
Split regions into test and control groups with similar past sales patterns.
Pause the chosen spend in control regions for 3 to 6 weeks while everything else stays the same.
Compare total orders in both groups from your backend, not from the ad platform.
Divide incremental revenue by test spend to get iROAS, and check that the result is statistically significant.

Figure 3: The shaded gap between the lines is the only revenue the ads truly created.
Holdout tests change budgets. In a randomized test run with Crealytics, UK retailer Dunelm found Facebook prospecting delivered a 5.7x higher return than retargeting, then moved its prospecting share of spend from 55 to 70 percent. That decision was invisible in platform ROAS.
Two cautions. First, tests need enough volume. An underpowered test returns a wide range that includes zero, which is not proof the channel failed. Second, platform-run lift studies are useful but not independent. The IAB and IAB Europe rank platform-reported incrementally as the weakest of four evidence tiers because it lacks an independent control group.
Marketing Mix Modeling for the Bigger Picture
You cannot run holdout tests on everything all the time. Marketing mix modeling (MMM) fills that gap. It uses two or more years of weekly spend, sales, pricing, seasonality and festival data to estimate how much each channel contributes to revenue, without tracking any individual user.
MMM used to require expensive vendors. Today Google's Meridian, Meta's Robyn and PyMC-Marketing are all open source, which puts a working model within reach of mid-size brands with a capable analyst. Be aware that a model is only as good as its inputs. The best practice is to calibrate MMM with your holdout results so the model learns from real experiments rather than correlation alone.
Use MMM when: you spend across 3 or more channels, have at least 2 years of clean weekly data, and need to plan quarterly budgets.
Skip it for now when: spend is small or concentrated in one platform. Blended ROAS plus one holdout test will teach you more.
The True ROAS Measurement Stack
No single metric is enough. The brands that measure well use each tool for the decision it suits best, from fast and noisy at the bottom to slow and reliable at the top.

Figure 4: Each layer answers a different question at a different speed.
Tool | Best for | Watch out for |
|---|---|---|
Platform-reported ROAS | Comparing ads, creatives and audiences inside one platform | Double counting, view-through credit, brand and retargeting bias |
Blended ROAS / MER | Weekly health check of total marketing | Cannot split results by channel |
Holdout test | Proving whether a channel causes sales | Needs volume, time and a willingness to pause spend |
Marketing mix modeling | Quarterly budget allocation across channels | Needs long, clean history; calibrate with tests |
A 30-Day Plan to Find Your True ROAS
Week 1, reconcile: pull last month's claimed revenue from every platform and compare the total with backend revenue. The ratio is your inflation factor.
Week 1, fix tracking: confirm Meta Conversions API and Google Enhanced Conversions are live and deduplicating with event IDs. Bad data makes every later step worse.
Week 2, set the scoreboard: report blended ROAS and MER weekly next to platform ROAS so the gap is visible to everyone.
Week 2, split the view: separate brand from non-brand search and prospecting from retargeting. Compare each with view-through credit excluded.
Weeks 3 to 4, test one thing: run a geo holdout on your most suspicious line item, usually brand search or retargeting.
After the test, recalibrate: apply the measured iROAS as a multiplier on that channel's platform ROAS when you set targets, and move budget accordingly.
Common Mistakes to Avoid
Adding platform numbers together. The sum will always overstate revenue.
Cutting upper-funnel video because its dashboard ROAS is low. It may be feeding the brand searches that look so profitable.
Testing during a sale or festival week. Diwali or a 50 percent off event will swamp the signal.
Treating one test as permanent truth. Incrementality shifts with creative, season and spend level. Retest every quarter or two.
Ignoring margins. A 3x ROAS on a 30 percent margin product loses money. Always translate ROAS into contribution profit.
Conclusion
Your dashboard ROAS is not fake. It is a credit report, and every platform writes its own. True ROAS measurement means pairing that credit report with numbers no platform controls: your total revenue, your margins and controlled experiments. Start with blended ROAS and MER this week, run one holdout test this month, and let what you learn reshape your budget.
Want to see how inflated your own numbers are? NYX's free ad account audit compares what Meta and Google report against what your business actually earned, and shows where budget is chasing sales you would have made anyway.